SNLA433A August 2023 – December 2024 DS320PR1601 , DS320PR410 , DS320PR810 , SN75LVPE5412 , SN75LVPE5421
2.4.1 Detailed Description of Parameters Calibration
- Amplitude or VOD Calibration: Amplitude calibration is done at TP3 using a mixed clock and low frequency pattern at 32Gbps. Under this condition, compliance must be confirmed with PCIe Gen5 using P1 through P9 presets.
- RJ Calibration is performed at TP3. PCIE calibration pattern is used at P4 along with the SigTest Phoenix 5.1.04 RJ_SJ_CAL template to analyze RJ. Target RJ is 0.5ps rms at TP3.
- SJ Calibration is similar to RJ and the target value is 1-5ps.
- Insertion Loss Calibration is performed at TP2. Figure 2-7 and Figure 2-8 show loss targets for different elements within the signal path and CBB/CLB with ISI loss board setup.
- AIC DMI (Differential Mode Interference) is performed at TP2 with 31.8 dB total channel loss at TP2. Phoenix uses 4.2 dB for AIC package loss. P4 preset and DMI/CMI patterns modulated with 2.1 GHz signal are used to achieve targeted 5-30 mV DMI at TP2.
- CMI is the same as DMI and performed at TP2 is as well. A 120 MHz CMI is used to achieve a target value of 150 mV.
- TX EQ Calibration: BERT is calibrated to the noise values. Using presets P5/6/8/9, the best CTLE and preset are selected based on which produce the best eye area at TP2.
- Insertion loss decremented—from 36 dB—in 0.5 d B/step, DMI in 3 mV increments, SJ in 10 mUI increments, SJ in 10 mV increments, and device CTLE gain swept from 7 through 12 to achieve best Eye Height (EH) and Eye Width (EW).
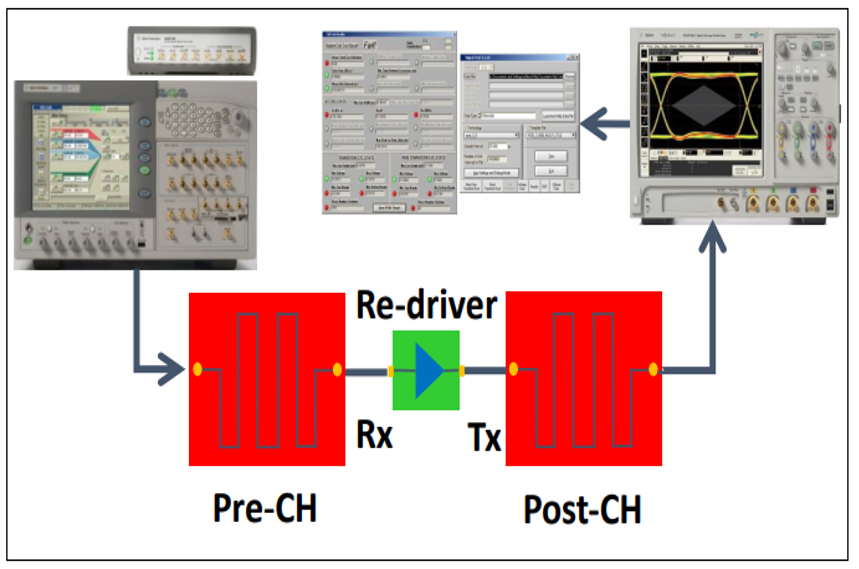
The DS320PR1601 performance matrix in Table 2-3 shows the device performance with various pre-channel and post-channel combinations using the RX Equalization methodology just discussed.
 Figure 2-11 AIC Testing Overview
After calibration and operating in AIC mode, Table 2-3 shows the device performance with various pre-channel and post-channel combinations using PCIe Gen5 RX Equalization methodology
Table 2-3 Device Performance Across
Pre-Channel and Post-Channel Losses
| Pre-Channel Loss (dB) | Post-Channel Loss (dB) | EQ Index/DC Gain/Preset | Eye Width (UI) | Eye Height (mV) |
|---|---|---|---|---|
| 10 | 32 | 2/L2/P6 | 0.39 | 35.74 |
| 14 | 26 | 2/L2/P6 | 0.41 | 46 |
| 14 | 32 | 7/L2/P6 | 0.35 | 36.83 |
| 18 | 22 | 2/L4/P6 | 0.4 | 72.5 |
| 18 | 26 | 3/L2/P6 | 0.4 | 48.21 |
| 22 | 18 | 1/L2/P6 | 0.44 | 67.7 |
| 22 | 22 | 3/L2/P6 | 0.39 | 40.91 |
| 22 | 26 | 7/L2/P6 | 0.43 | 48 |
| 26 | 18 | 3/L2/P5 | 0.37 | 33.1 |
| 26 | 22 | 4/L2/P6 | 0.4 | 39.7 |
| 26 | 26 | 4/L2/P6 | 0.36 | 28.4 |
| 29 | 18 | 4/L2/P6 | 0.35 | 39.7 |
| 29 | 22 | 4/L2/P6 | 0.34 | 29.59 |