SNLA461 July 2024 DS320PR1601 , DS320PR410 , DS320PR810 , SN75LVPE5412 , SN75LVPE5421
3 EQ Amplifiers and EQ Indexes
In a PCIe redriver, equalization is carried out by a special analog filter consisting of several amplifiers. Overall, they comprise a continuous-time linear equalizer, or CTLE stage. The overall frequency response of the filter is designed to compensate for insertion loss of a certain type of signal media, typically copper PCB traces, and at various adjustable boost strengths so that the device can accurately compensate a range of losses – a fixed boost can be inflexible because applying too much or too little boost relative to the actual amount of loss in the system can negatively impact signal quality.
Focusing on TI PCIe Gen 5 redrivers as an example, the equalization system for each channel consists of three amplifiers:
- EQ Boost 1
- EQ Boost 2
- EQ Boost 1 (2nd order)
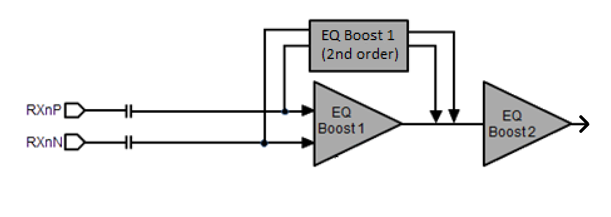 Figure 3-1 EQ Amplifiers for TI PCIe Gen 5 Redrivers
To provide finer control of the overall filter shape, each of these amplifiers focuses on a somewhat different frequency region. EQ Boost 1 tends to operate close to the Nyquist frequency, EQ Boost 2 tends to operate somewhat higher than Nyquist frequency, and EQ Boost 1 (2nd order) tends to operate at mid to lower frequencies. However the overall activities still overlap, so changing EQ Boost 1 (2nd order) for example affects the high frequency regions as well.
The following images illustrate some of the behavior of the individual amplifier settings in a network analyzer bench test setup; note that the methodology and trends are somewhat different from the EQ curves shown previously. EQ Index Default is used as a baseline for comparison and the data is saved in memory as the light pink trace. The magenta traces are data from custom settings altered from EQ Index Default by changing one of the amplifier settings to maximum or minimum.
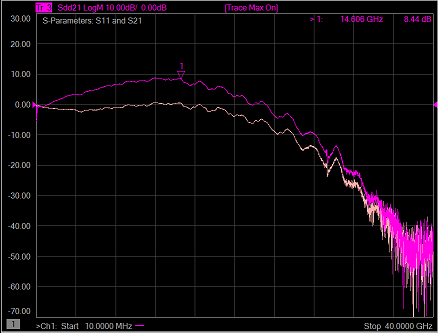 Figure 3-2 EQ Index Default vs Maximum EQ Boost 1
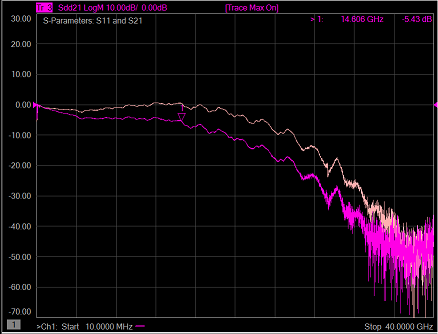 Figure 3-4 EQ Index Default vs Minimum EQ Boost 1 (2nd order)
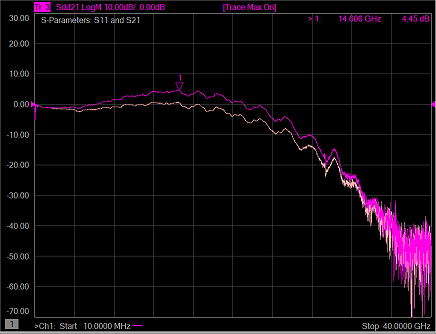 Figure 3-3 EQ Index Default vs Maximum EQ Boost 2
As adjusting the individual amplifier settings can be complicated, TI Gen 5 and Gen 4 redrivers organize combinations of the three amplifier settings into the EQ Index system, where EQ Index 0 is the lowest possible equalization setting of the redriver and higher indexes have successively higher boost strengths as measured by the boost applied at Nyquist frequency.
Table 3-1 taken from the How to Tune TI PCIe Gen5 Redrivers application note estimates boosts for every EQ Index in the Gen 5 redriver architecture. Note that the individual redriver products differ in the exact amount of boost for each setting, this table is for illustrative purposes only and the product data sheets can be consulted during project design.
| Equalization Selection | Typical EQ Boost | |
|---|---|---|
| EQ Index | Gain at 8GHz (dB) | Gain at 16GHz (dB) |
| 0 | 2.0 | 3.0 |
| 1 | 3.5 | 5.0 |
| 2 | 5.0 | 7.0 |
| 3 | 7.0 | 9.0 |
| 4 | 8.0 | 12.0 |
| 5 | 9.0 | 16.0 |
| 6 | 9.8 | 17.0 |
| 7 | 10.2 | 18.0 |
| 8 | 10.8 | 18.5 |
| 9 | 11.2 | 19.0 |
| 10 | 11.8 | 19.5 |
| 11 | 12.2 | 20.0 |
| 12 | 12.8 | 20.5 |
| 13 | 13.2 | 21.0 |
| 14 | 13.8 | 21.5 |
| 15 | 14.2 | 22.0 |
| 16 | 14.8 | 22.5 |
| 17 | 15.2 | 23.0 |
| 18 | 15.6 | 23.5 |
| 19 | 16.0 | 24.0 |
As mentioned before, insertion loss is commonly measured at the Nyquist frequency. The basic intuition is that a low EQ index with low boost at Nyquist is intended to compensate for a small amount of insertion loss, and higher EQ indexes with higher boosts can compensate for higher amounts of insertion loss. In most applications, this simplified view is sufficient for the use and tuning for the redriver.
In certain situations where the electromagnetic characteristics of the loss profile are quite different from simple PCB traces, or the signal performance margin is small and needs fine-tuning to optimize, then the filter activity at non-Nyquist frequencies can also be taken into account. Even consecutive EQ indexes can have major differences in the combinations of amplifier settings, leading to differences in filter activity beyond what the boost at Nyquist figures can suggest.
For example, in Gen 5 devices, EQ Index 4 and EQ Index 5 are consecutive and have similar boosts at Nyquist (approximately 8dB and 10dB at 16GHz respectively on the DS320PR810), but the amplifier configurations are unalike, as shown in the images of the TI SigCon Architect GUI software in Figure 3-5:
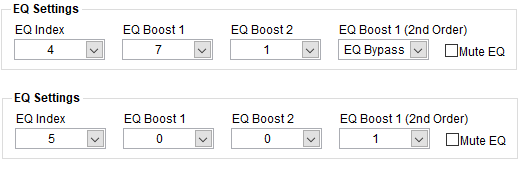 Figure 3-5 Comparison of EQ Index 4 and EQ Index 5
EQ Index 4 provides a high amount of boost centered at Nyquist frequency and slightly above, due to the EQ Boost 1 and EQ Boost 2 values, while EQ Boost 1 (2nd order) is bypassed. EQ Index 5 relies on EQ Boost 1 (2nd order) and therefore has more activity at the lower to medium frequency range in addition to the boost at Nyquist frequency.
For these reasons, selecting an appropriate EQ Index for an application can not be always as simple as calculating the amount of reach extension needed in a PCIe link and then picking the closest EQ Index based on values from the device data sheet. This can provide a starting point for further tuning, but is possible that better performance is achieved other nearby settings where the fine details of the filter shaping are a closer match for the system's actual loss profile. This can be explored during the board design process through signal integrity simulations and tested when tuning the redriver once the board has been manufactured.