SNLA461 July 2024 DS320PR1601 , DS320PR410 , DS320PR810 , SN75LVPE5412 , SN75LVPE5421
2 Insertion Loss and Equalization
To understand equalization, it is helpful to first discuss insertion loss. The physics of electromagnetic waves become complicated at high frequencies. Waves experience attenuation when they travel through a lossy medium, but the amount of attenuation, known as insertion loss, depends on both the characteristics of the medium and the frequency of the wave. A high-frequency data signal is necessarily composed of significant high-frequency components. As it travels through a copper wire or trace for example, the high-frequency components can experience more attenuation than the lower-frequency components, resulting a spectral imbalance that distorts the shape of the signal in the time domain.
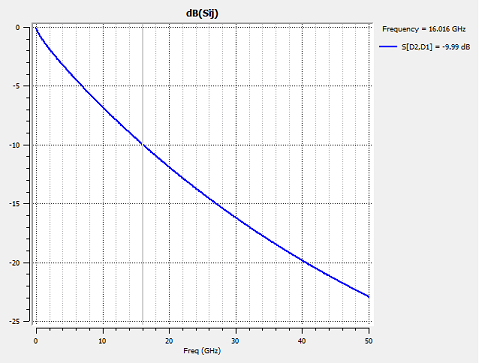
Figure 2-1 shows an example of insertion loss for a simulation model of a 5-inch length of FR4 trace: the loss starts from 0dB at DC, and becomes steadily larger with increasing frequency.
 Figure 2-1 Example of Insertion Loss for a 5-inch FR4 Trace
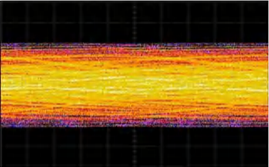
One of the main features of this distortion is a phenomenon known as inter-symbol interference, or ISI. Signal edges and sharp, rapid transitions in general are formed by high-frequency components. When these are degraded in a sequence of symbols, symbols begin bleeding into each other, causing significant distortions in signal shaping. This can result in bit errors when the receiver samples these degraded symbols, and if severe enough the input is not intelligible at all to the receiver – an eye diagram can show a closed eye with no meaningful opening to distinguish and interpret signals, as in Figure 2-2.
 Figure 2-2 Eye Diagram of Signal with Severe ISI
In general, increasing the loss between the sender and receiver of a signal by extending the length or increasing the data rate can result in lower and lower signal quality until some limit where reliable and error-free operation cannot be maintained.
Since the amount of loss in a data channel is an important factor, there must be a convenient way to measure or quantify the loss at a system level. In the field of signal integrity, the loss of an element is usually measured in terms of insertion loss of a certain dB at a certain Nyquist frequency, the frequency that is half of the symbol rate. The reason for this is that for PRBS data at a certain rate, the vast majority (over 90%) of the signal energy is concentrated at or below the Nyquist frequency, so the Nyquist frequency can be used as an upper bound for the region where degradation must be seriously accounted for. Degradation above Nyquist frequency can still negatively affect the signal, but to a lesser extent.
In PCIe, the Nyquist frequency for PCIe Gen 5 (32 GT/s data transfer) is 32GHz ÷ 2 = 16GHz. For Gen 4 (16 GT/s data transfer), is 16GHz ÷ 2 = 8GHz. An example insertion loss figure of -4dB at 16GHz for an element along the signal path implies that a 16GHz pure sine wave is attenuated by 4 dB after passing through it, and that this information is most relevant for PCIe Gen 5 operation. For differential protocols like PCIe, insertion loss can be calculated from two-port S-parameters as S[D2, D1], the differential-mode to differential-mode gain.
While this loss-induced signal degradation can be a major problem for system designers, degradation can be repaired. Theoretically, an element whose frequency response is the mathematical inverse of the applied loss can be able to restore the original signal. The cascaded response of the loss and the element can be unity across all frequencies, preserving the characteristics of the original signal. This is the fundamental idea behind equalization: an active device can perform frequency-selective amplification to counter the effects of frequency-selective loss.
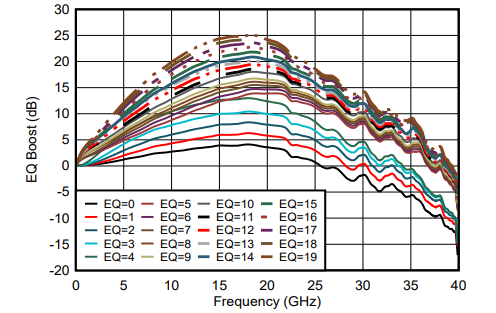
Figure 2-3 shows the EQ boosts for the DS320PR810 PCIe Gen 5 redriver: the positive magnitude and positive slope up to and beyond 16GHz means there is gain or amplification of such frequencies, and the stronger EQ settings increase the slope to compensate for more loss.
 Figure 2-3 EQ Boost Curves for DS320PR810
In practice, this restoration cannot be exactly perfect, because the media of an actual system and the behavior of an actual active device can both be non-ideal. Equalization therefore compensates for insertion loss. The processed signal can have some inevitable spectral and shaping differences from the original pre-degradation signal, but successful compensation can result in an open eye diagram that the signal receiver can interpret without error.
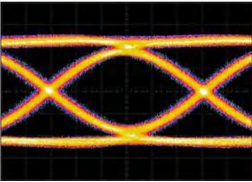
Figure 2-4 shows the same signal from Figure 2-2 after passing through a redriver.
 Figure 2-4 Correction of ISI by a Redriver
As such, equalization is a powerful tool to restore signal quality and enable longer PCIe links.