SBOA518 January 2022 TMCS1100 , TMCS1100-Q1 , TMCS1101 , TMCS1101-Q1 , TMCS1107 , TMCS1107-Q1 , TMCS1108 , TMCS1108-Q1
4.2 Noise Limitations
In the absence of an input current signal, the output noise is very dependent on grounding techniques as discussed in the Grounding section. Even with proper grounding techniques, a systematic noise remains due to the sampling integrator used to minimize temperature and lifetime drift. The input is sampled every 4 μs and the output is updated at a 250-kHz update rate, as discussed in the data sheet. In many cases, the impact of this noise floor can be minimized with a simple low-pass filter on the output of the device. However, first consider the RMS and peak-to-peak output noise from the device. To begin, the RMS and peak-to-peak noise output of the device under consideration can be determined using Equation 4 and Equation 5. The referred-to-input (RTI) noise density specifications are listed from the data sheet in TMCS1101 Data Sheet: Noise Density, RTI for convenience.
| PARAMETERS | TEST CONDITIONS | MIN | TYP | MAX | UNIT | |
|---|---|---|---|---|---|---|
| OUTPUT | ||||||
| Noise density, RTI | TMCS1100A1 | 380 | μA/√ Hz | |||
| TMCS1100A2 | 330 | μA/√ Hz | ||||
| TMCS1100A3 | 300 | μA/√ Hz | ||||
| TMCS1100A4 | 225 | μA/√ Hz | ||||
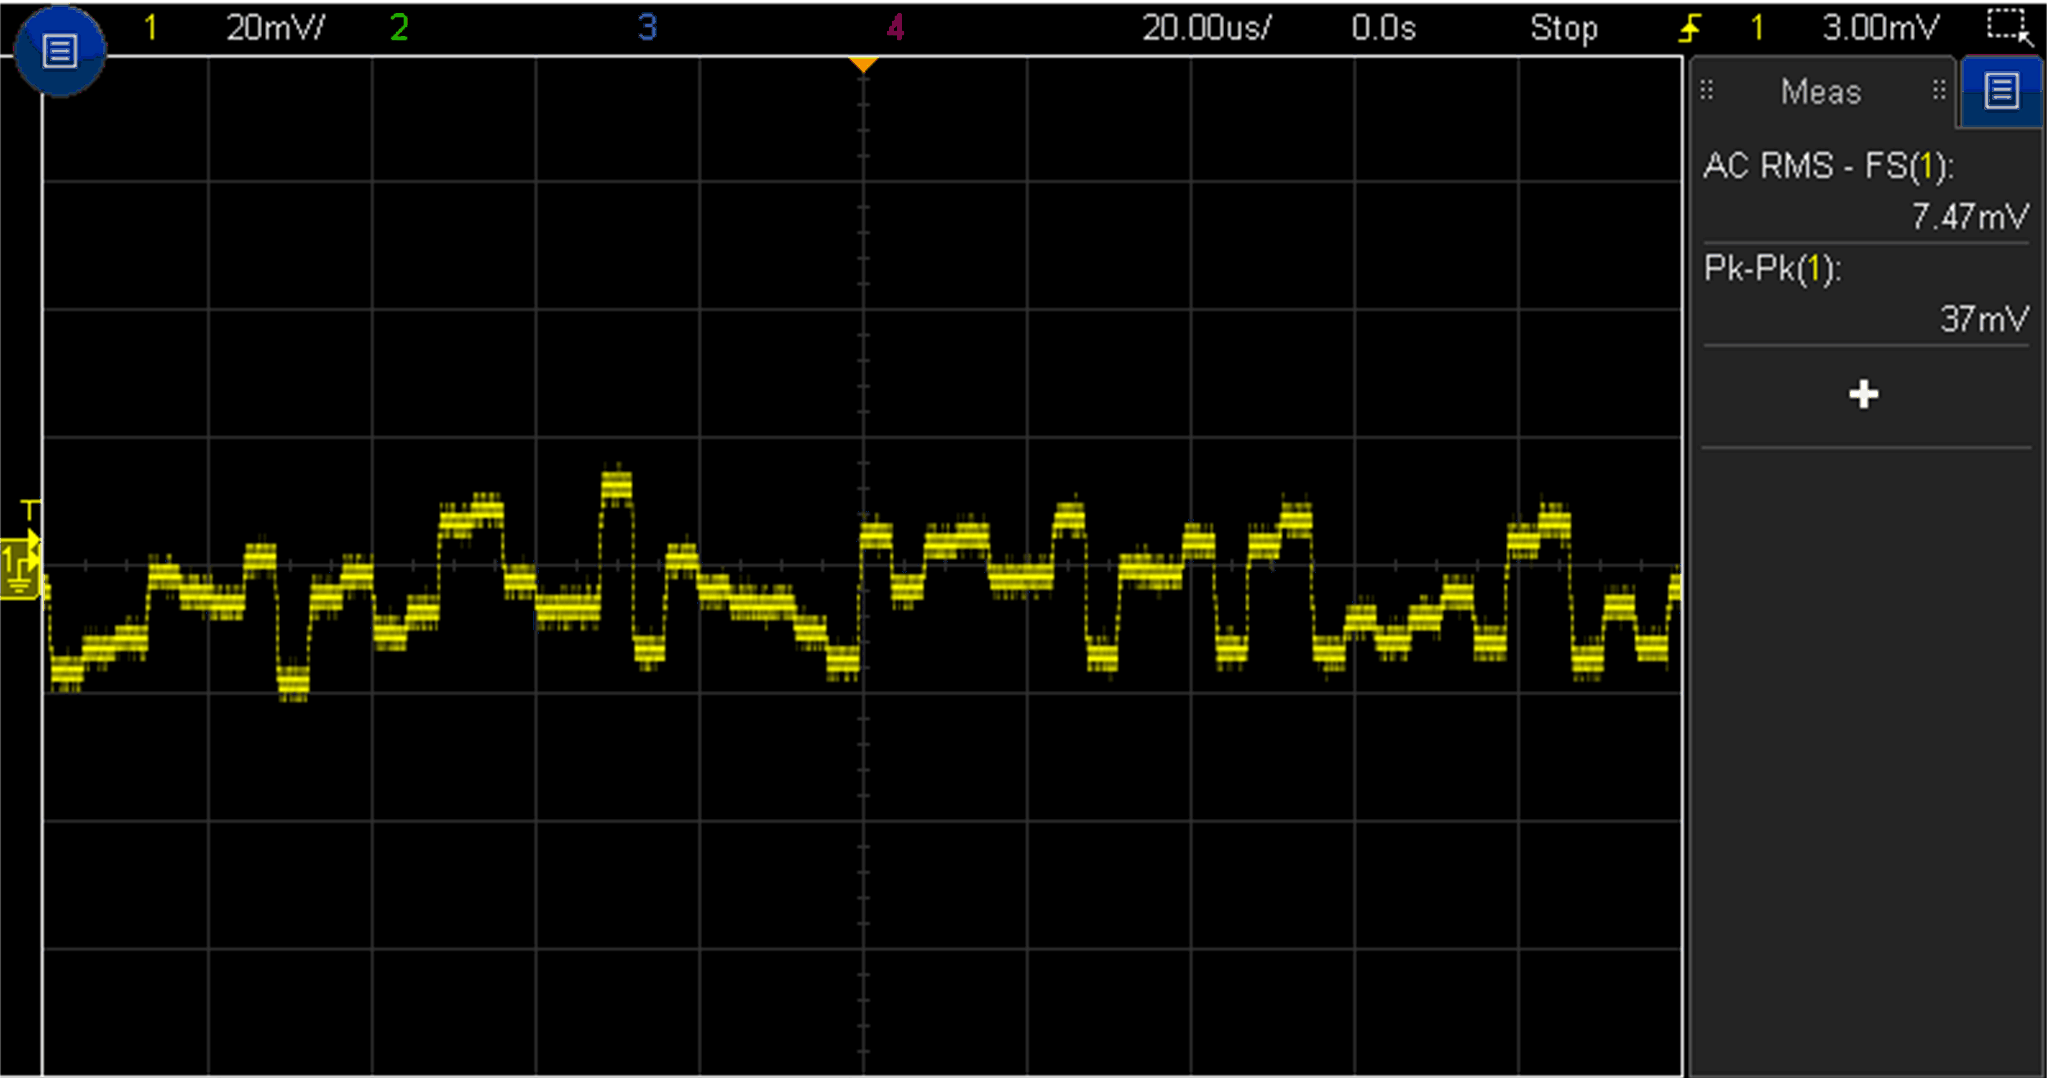
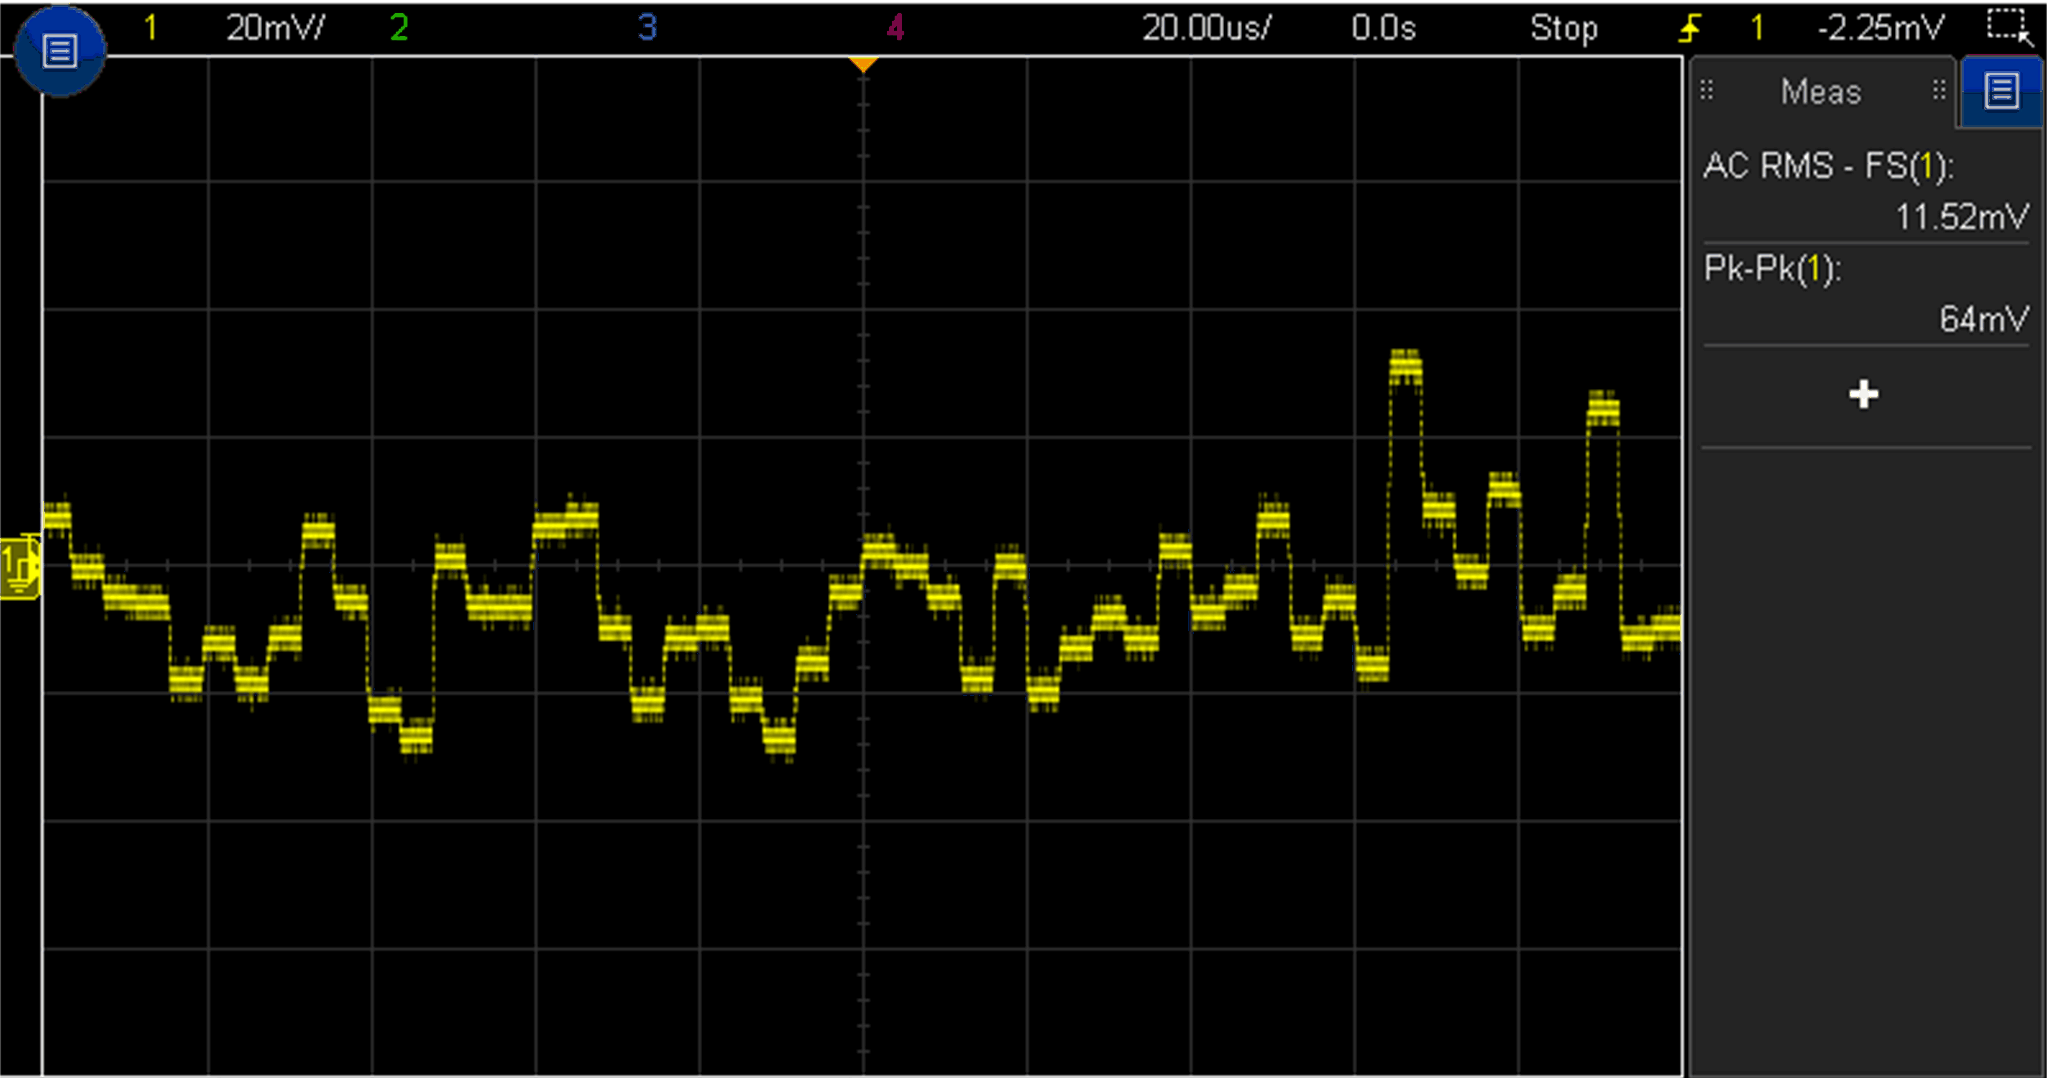
These equations provide the theoretical RMS and peak-to-peak noise levels of each device, with the peak-to-peak calculation accounting for 99.9% of the distribution of the spectrum in the peak-to-peak measurement (for more information on how to calculate noise, see the our Analog Engineer's Pocket Reference). Figure 4-1 through Figure 4-4 show the noise floor of each TMCS1100 gain variants captured on the TMCS1100EVM with no output filtering. It can be observed that, as expected, the noise floor grows in proportion with the sensitivity, shown in the previous noise equations. Note that the RMS and peak-to-peak noise floor values are shown on the scope for each plot as well.
 Figure 4-1 A1 Variant Noise Floor With
RMS and P2P Values
 Figure 4-2 A2 Variant Noise Floor With
RMS and P2P Values
 Figure 4-3 A3 Variant Noise Floor With
RMS and P2P Values
 Figure 4-4 A4 Variant Noise Floor With
RMS and P2P Values
Figure 4-4 A4 Variant Noise Floor With
RMS and P2P ValuesA common technique used to resolve small signals in the presence of noise is to increase overall Signal-to-Noise Ratio (SNR) by limiting the Noise Equivalent Bandwidth (NEBW) using a low-pass filter on the output of the device. When sized properly, a simple low-pass filter attenuates overall noise contributions from the 250-kHz signature of the sampling integrator. This implementation attenuates contributions from the 250-kHz signature of the sampling integrator, as well as reduces noise spectrum contributions from the portion of bandwidth attenuated by the new cutoff frequency. Figure 4-5 through Figure 4-8 show the improvement of the noise floor of the A2 variant for various cutoff frequencies. Note from A2 Output with Low-Pass Filter, Cutoff Frequency = 80 kHz that even a low-pass filter set at the bandwidth of the part provides improvement. While this filter does not reduce noise contributions, it attenuates steps from the 250-kHz signature on the output without degrading output fidelity.
 Figure 4-5 A2 Output With Low-Pass
Filter, Cutoff Frequency = 100 kHz
 Figure 4-6 A2
Output With Low-Pass Filter, Cutoff Frequency = 80 kHz
 Figure 4-7 A2 Output With Low-Pass
Filter, Cutoff Frequency = 40 kHz
 Figure 4-8 A2 Output With Low-Pass
Filter, Cutoff Frequency = 500 Hz