-
Loop Gain Reconstruction of a Step-Down Converter from Output Impedance Measurement SLUAAI0 January 2022 TPS62810-Q1 , TPS62811-Q1 , TPS62812-Q1 , TPS62813-Q1 , TPS62816-Q1 , TPS628501 , TPS628501-Q1 , TPS628502 , TPS628502-Q1 , TPS628503 , TPS628503-Q1 , TPS628510 , TPS628511 , TPS628512 , TPS62870 , TPS62870-Q1 , TPS62871 , TPS62871-Q1 , TPS62872 , TPS62872-Q1 , TPS62873 , TPS62873-Q1 , TPS62874-Q1 , TPS62875-Q1 , TPS62876-Q1 , TPS62877-Q1 , TPS62A01 , TPS62A01A , TPS62A02 , TPS62A02A , TPS62A06 , TPS62A06A , TPSM82810 , TPSM82813 , TPSM8287A06 , TPSM8287A10 , TPSM8287A12 , TPSM8287A15
-
Loop Gain Reconstruction of a Step-Down Converter from Output Impedance Measurement
Loop Gain Reconstruction of a Step-Down Converter from Output Impedance Measurement
Trademarks
All trademarks are the property of their respective owners.
1 Introduction
The loop gain measurement shows the stability and robustness of the control loop of a power supply and provides insight to improve output transient response. For the characterization of the loop, the open loop gain is commonly measured by using the voltage injection method.
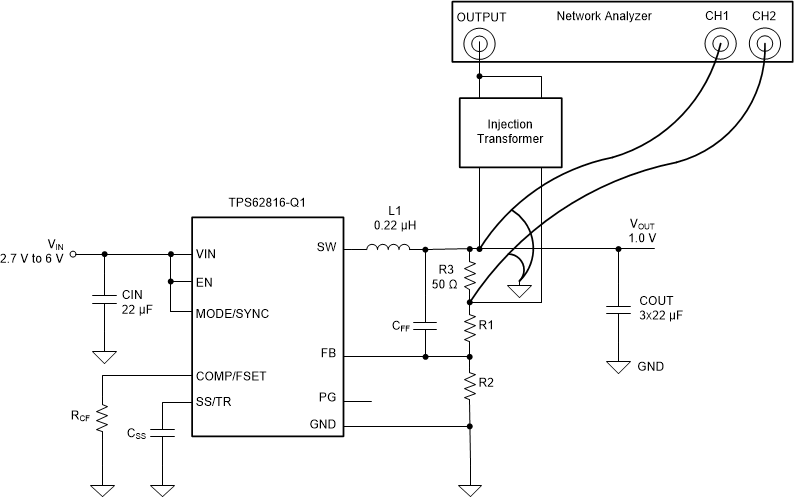
Figure 1-1 shows a common method to measure loop gain of a DC-DC converter, the voltage injection method. This method consists of breaking the control loop in a single place with a resistor and injecting into the loop a sinusoidal disturbance at different frequencies with an injection transformer. Relative magnitudes and phase of the input signal and output signal versus frequency will be subsequently measured.
The voltage injection method approach ensures correct quiescent operating conditions in the system and avoids a common difficulty in systems having a large DC loop gain. However, the limitation is that the voltage injection method requires breaking the control loop by placing an additional resistor at a suitable point.
 Figure 1-1 Output Impedance Setup for TPS62816
Adding additional components could weaken the noise immunity of a device by making the feedback signal trace longer. Thus, making control loop more sensitive to fast switching signals. Besides, the voltage injection approach might not be an acceptable method for space-limited designs.
To avoid breaking the feedback loop, an alternative method is proposed to obtain the loop gain from the output impedance measurements of a DC-DC converter.
The output impedance is an important parameter to characterize a switching voltage regulator and help evaluate how the converter will respond to load changes at different frequencies. Valuable information such as control loop stability, decoupling networks powering the device, dynamic load response and the susceptibility of the power supply to complex loads can be derived from an output impedance measurement.
This application report shows the details of the loop gain measurement of a switching voltage regulator using output impedance measurements and results obtained with TPS62816.
2 Loop Gain Measurement
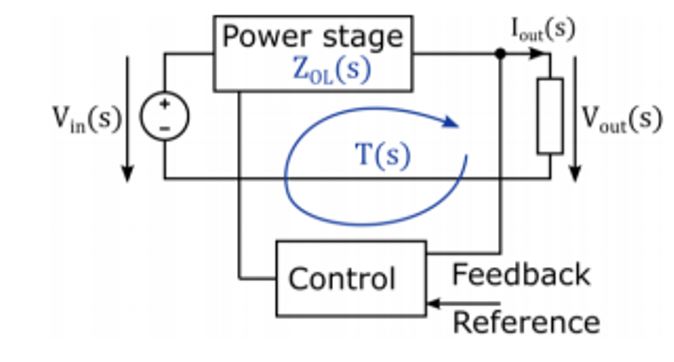
Step-down converters have basic blocks that contribute to the closed loop system. Figure 2-1 shows a closed loop system for a generic step-down converter.
 Figure 2-1 Closed Loop System for a Generic Step-down Converter
is the open loop output impedance of the power stage loop gain and is defined as the product of all gains around the loop. When the loop is open, the power stage is running at a constant operating point meaning the controller signal stays constant.
When the loop is closed, converter is running in normal operation. The closed loop output impedance is :
From this equation we can deduct that the higher the loop gain is, the more the output impedance is reduced by the feedback loop. While designing a power supply, reducing the output impedance is possible by adding output capacitance to lower the open loop impedance. Especially for high-current operation, making sure that the output impedance is low across the frequencies is important to enable good load transients. Though, this method comes to a size and bill of material cost, it might also degrade performance for some designs where a maximum output capacitance should not be exceeded.
From the previous formula we can derive the loop gain:
3 Output Impedance Measurement of TPS62816
Figure 3-1 shows the output impedance measurement test setup. For more details regarding the impedance measurement method and different steps for a good calibration, refer to the How to Measure the Power Delivery Network Impedance of a DC-DC Converter.
Figure 3-2 shows the output impedance comparison when the loop is open and when loop is closed with a 500mΩ resistive load connected to GND at the output. The respective Phases are plotted in Figure 3-3.
 Figure 3-2 Output Impedance Measurements Magnitude for TPS62816
 Figure 3-3 Output Impedance Measurements Magnitude for TPS62816
For the open loop impedance, at low frequencies the impedance curve is influenced by the constant output resistance of 500mΩ. Above 10 kHz, the measured impedance tracks the impedance of the output capacitor bank, flattening out with its ESR value at 500 kHz. The far right part of the curve is dominated by the inductive behavior of the capacitance at very high frequencies.
For the closed loop impedance, at low frequencies a high DC loop gain value can be observed which results in a low output impedance. At higher frequencies, the measured impedance curve shows a similar behavior as in an open loop condition.
A particular characteristics of loop gain stability is that for the frequencies of interests the closed loop impedance is higher than the open loop. This behavior is due to control loop stability and can be observed between 100 kHz and 500 kHz. This specific frequency range will help us determine by calculation the phase margin as well as the crossover frequency of the TPS62816.
To facilitate further processing, a math function can be used to divide the open loop output impedance by the closed loop output impedance :
 Figure 3-4 Open Loop Impedance Divided by Closed Loop Impedance
4 Bode Plot Reconstruction and Comparisons with Voltage Injection Method
The loop gain is a complex number with a real and an imaginary part due to the complex impedance. The information needed to calculate the loop gain are the magnitude Mag[T(s)] and the phase Phase[T(s)] respectively shown in Equation 4 and Equation 5.
To visualize data and apply formula to taken values, the use of an analytics solution may be required. All Network Analyzer do not provide flexible interface to analyze data.
Figure 4-1 shows a comparison of the reconstructed gain to measured voltage injection method.
The reconstructed gain using the Equation 4 from the impedance measurements shows a very good matching result until the lowest frequency. The red curve shows the real loop gain and the blue curve the calculated loop gain.
 Figure 4-1 Loop Gain Magnitude with Output Impedance Reconstruction (blue) and with Voltage Injection Method (red)
Operating Conditions: =3.3 V, =1.0V, =2 A
Crossover Frequency: 141.25 kHz (Red curve), 146.27 kHz (Blue curve)
Figure 4-2 shows a comparison of the reconstructed phase to measured voltage injection method.
The red curve of Figure 4-2 shows the measured voltage injection method phase and the blue curve shows the calculated phase, reconstructed using the Equation 5 from the impedance measurements.
 Figure 4-2 Loop Gain Phase with Output Impedance Reconstruction (blue) and with Voltage Injection Method (red)
Operating Conditions: =3.3 V, =1.0V, =2 A
Phase Margin: 69.28° C (Red curve), 61.17° C (Blue curve)
5 Conclusion
As demonstrated in this application note, a loop gain reconstruction can be performed by measuring the output impedance of a DC-DC converter in different operating states. An output impedance measurement can give very useful insights regarding the DC-DC converter performances. In addition to bandwidth and phase margin evaluation of a power supply, an output impedance measurement can also help to evaluate the converter ability to recover from a certain load or to verify that a target output Impedance is met to achieve a strict load step requirement.
6 References
- Output Impedance Measurements and Loop Gains
- Output Impedance for Stability Analysis
- Deviation of Loop Gain from Output Impedances in DC-DC Buck Converter
- Texas Instruments, How to Measure the Control Loop of DCS-Control Devices application report
- Texas Instruments, A Topical Index of TI Low Power Buck DC/DC application report
IMPORTANT NOTICE AND DISCLAIMER
| TI PROVIDES TECHNICAL AND RELIABILITY DATA (INCLUDING DATASHEETS), DESIGN RESOURCES (INCLUDING REFERENCE DESIGNS), APPLICATION OR OTHER DESIGN ADVICE, WEB TOOLS, SAFETY INFORMATION, AND OTHER RESOURCES “AS IS” AND WITH ALL FAULTS, AND DISCLAIMS ALL WARRANTIES, EXPRESS AND IMPLIED, INCLUDING WITHOUT LIMITATION ANY IMPLIED WARRANTIES OF MERCHANTABILITY, FITNESS FOR A PARTICULAR PURPOSE OR NON-INFRINGEMENT OF THIRD PARTY INTELLECTUAL PROPERTY RIGHTS. |
| These resources are intended for skilled developers designing with TI products. You are solely responsible for (1) selecting the appropriate TI products for your application, (2) designing, validating and testing your application, and (3) ensuring your application meets applicable standards, and any other safety, security, or other requirements. These resources are subject to change without notice. TI grants you permission to use these resources only for development of an application that uses the TI products described in the resource. Other reproduction and display of these resources is prohibited. No license is granted to any other TI intellectual property right or to any third party intellectual property right. TI disclaims responsibility for, and you will fully indemnify TI and its representatives against, any claims, damages, costs, losses, and liabilities arising out of your use of these resources. |
| TI’s products are provided subject to TI’s Terms of Sale (www.ti.com/legal/termsofsale.html) or other applicable terms available either on ti.com or provided in conjunction with such TI products. TI’s provision of these resources does not expand or otherwise alter TI’s applicable warranties or warranty disclaimers for TI products. |
| Mailing Address: Texas Instruments, Post Office Box 655303, Dallas, Texas 75265
Copyright © 2021, Texas Instruments Incorporated |