SLVAF22C January 2021 – October 2024 TPS544C26 , TPS544C27 , TPS544E27 , TPS546C25 , TPS546E25 , TPS548A28 , TPS548B23 , TPS548B28 , TPS548C26 , TPS548D26 , TPS54J061 , TPS54KB20 , TPS54KC23 , TPS748A
- 1
- Abstract
- Trademarks
- 1Suggested DC/DC Converters
- 2Voltage Regulation Accuracy
- 3Load Transient Response with D-CAP4
- 4Security Features
- 5High Efficiency and Thermal Performance
- 6Linear Regulator with Adjustable Soft-Start and High Output Voltage Accuracy
- 7Conclusion
- 8Additional Resources
- 9Revision History
5 High Efficiency and Thermal Performance
Rack servers employ circuit boards with many PCB layers, depending on the form factor constraints. Since the rack server is designed to be used in tight spaces, consider the thermal environment and available airflow when selecting DC/DC converters. The ambient temperature inside a rack server is typically between 60°C and 70°C since forced airflow is usually available. Higher circuit board temperatures translate to lower reliability, and higher current DC/DC converters contribute to the overall thermal budget.
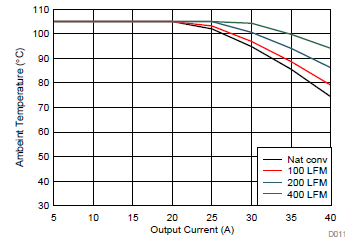
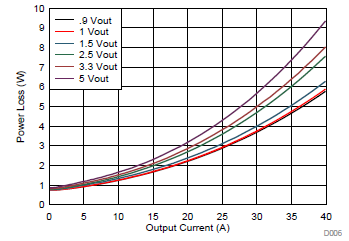
Figure 5-1 shows the safe operating curve and Figure 5-2 shows the power loss plot of TPS543C20A. The TPS543C20A DC/DC converter delivers 40 A and 1 V output with an ambient temperature of 75°C, without airflow. At 25 A and 1 V output, the entire solution dissipates less than 3 W, which translates to around 90% efficiency when switching at 500 kHz.
The TPS543C20A measured junction-to-ambient thermal resistance is 12°C/W based on a 6-layer, 2-oz Cu per layer and a 2.75 inch by 3 inch board size, which demonstrates low thermal resistance. However, many thermal metrics exist for semiconductor and IC packages, which range from RθJA to ψJT. Often, designers misapply these thermal metrics when trying to estimate the junction temperatures in their systems. Ultimately, thermal performance depends on the circuit-board layout and using standard JEDEC-referenced thermal numbers. (2)
 Figure 5-1 SOA Curve for TPS543C20A
 Figure 5-2 Power Loss Curves for TPS543C20A